ES:Estadísticas
Si comprendes el artículo original en inglés, por favor, ayuda a completar esta traducción al español. Lee las instrucciones sobre cómo traducir este wiki.
Parece que nadie está trabajando en la traducción en este momento. Anímate y colabora en la tarea de traducción.
Estadísticas que rastrean el notable crecimiento de la base de datos y la comunidad de OpenStreetMap
| Database statistics | Automaticamente actualizado a diario. Analiza la base de datos OpenStreetMap – muestra el número de vías, nodos, relaciones, y más. La página también muestra una tabla de clasificación de los perfiles personales que suben datos. Existe un historial de estos datos completos remontando al 2007 y algunos datos básicos desde el 2005. |
| Taginfo | Taginfo analyzes OSM tag usage. Has many different reports on tags and also on the number of objects in the database. |
| Server statistics | Showing the disk, memory, I/O, bandwidth stats of each of the OpenStreetMap servers |
| 'awstats' for www or for planet |
Web site access statistics with lots of detail about the visited pages and the visitors. |
| very basic wiki statistics | Showing basic statistics (for the job queue, see site info statistics). Please note: more extensive statistics distorted from 2007-10-12 due to Proxy-Cache running in front of webserver. |
| Feature requests | Put your request on the talk page |
In summary
- Current approximation of the number of users: más de diez millones (based on https://www.openstreetmap.org/stats/data_stats.html)
- 5.5 million users (2019-06-07)
- 5 billion nodes (2019-06-07)
- 3 millions changesets/day (2017-11-08)
- 1 million contributors (2018-03-18)
Database statistics - Active reports
- Editor usage stats (since 2009) generated from changeset information since API 0.6 in 2009.
- Editing frequency (2010) generated from changeset information since API 0.6 in 2009, and synthesized changesets since 0.5.
Database statistics - Graphical charts (since 2005)
These historical graphical charts below use the daily database data summary. The charts are updated periodically by Blackadder.
The current status of the database can be seen on Database statistics.
Users and GPX uploads
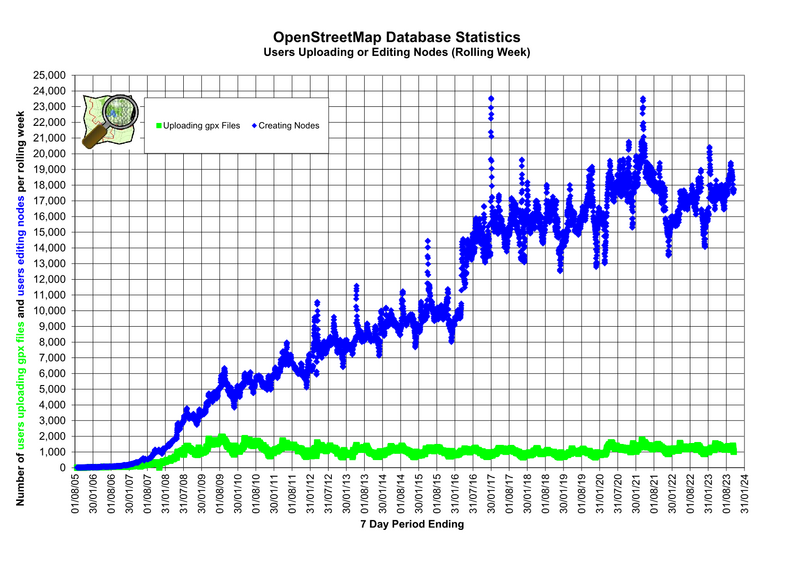
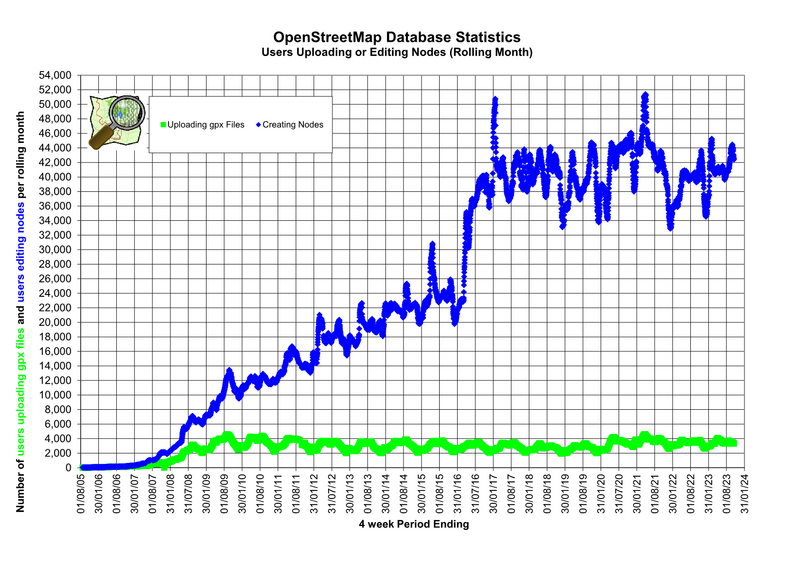
Contributors editing nodes or uploading GPX nodes
These two graphics are counting contributors by rolling month or by rolling week.
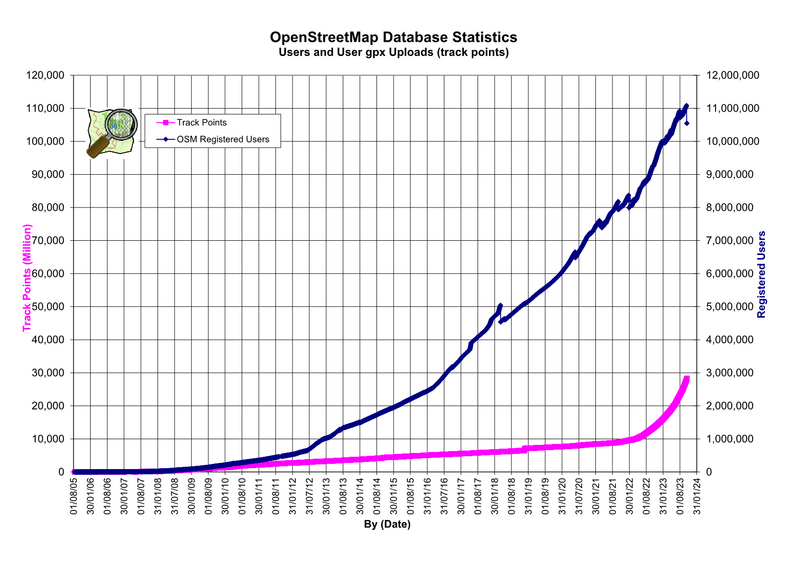
Accumulated users and GPX uploads
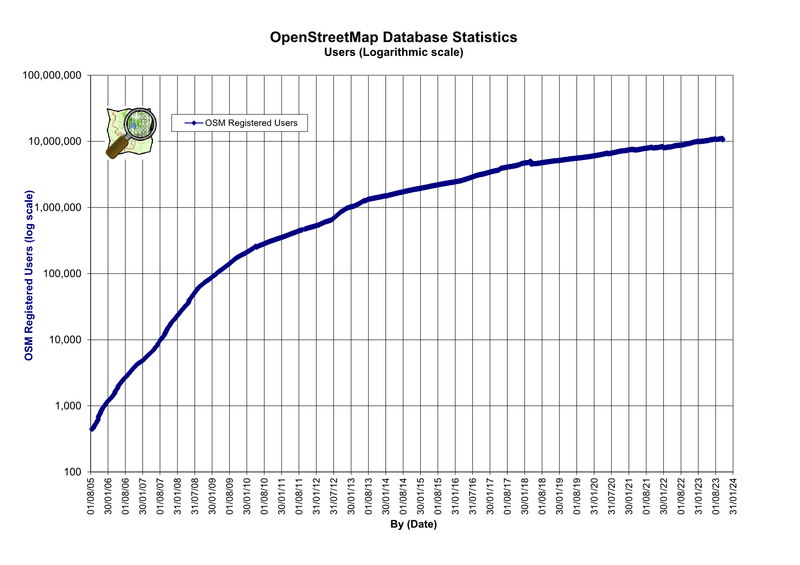
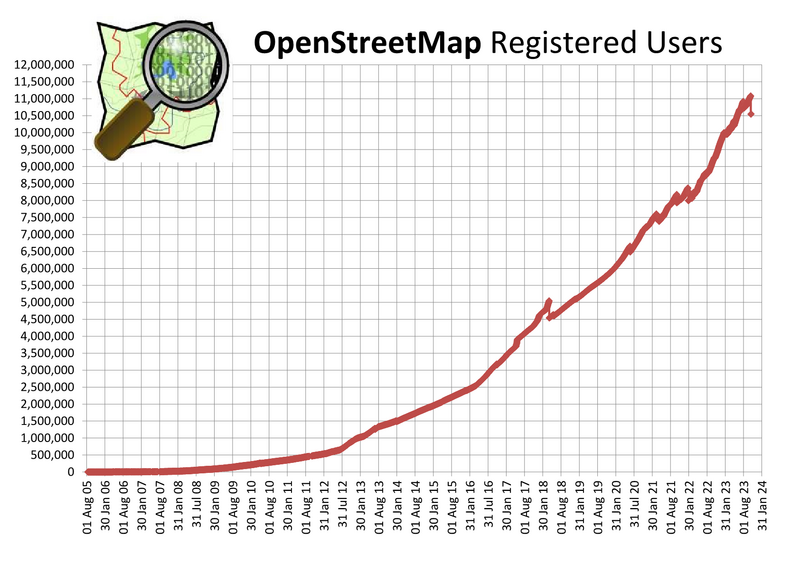
Registered users statistics reports
Accumulated registered users (log scale)
Accumulated registered users (linear scale)
Nodes, ways and relations
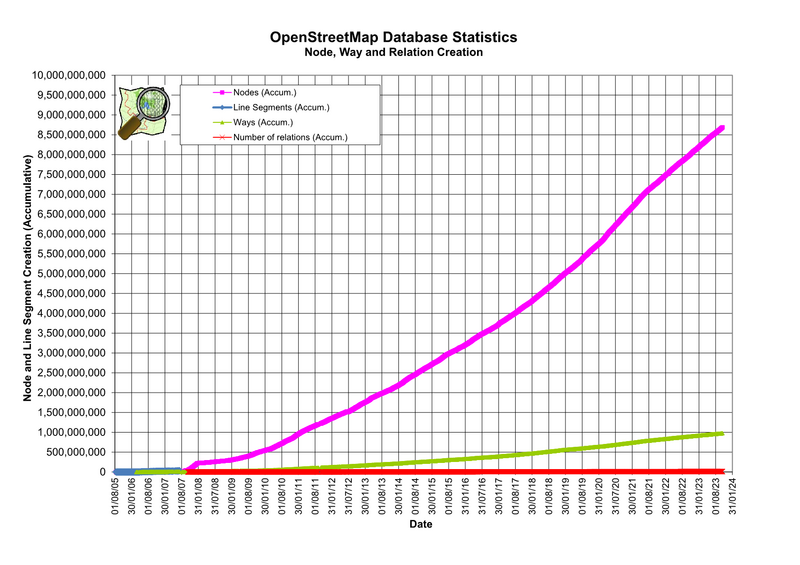
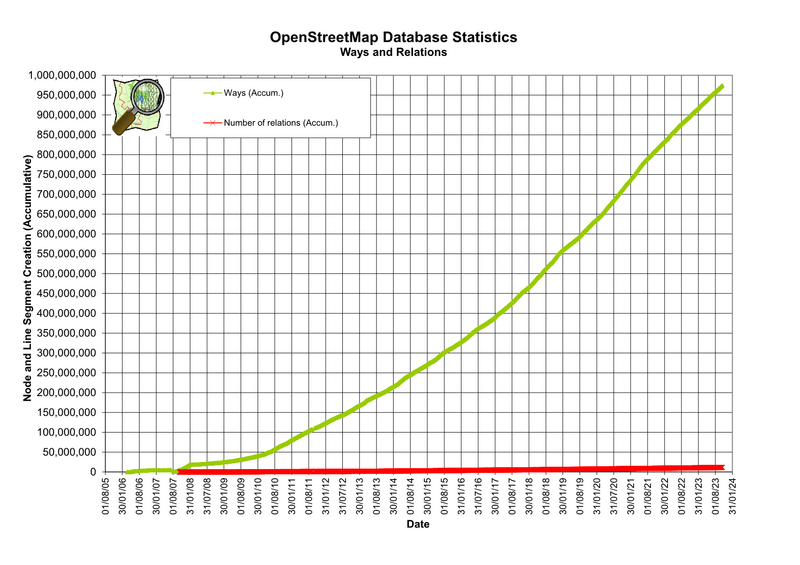
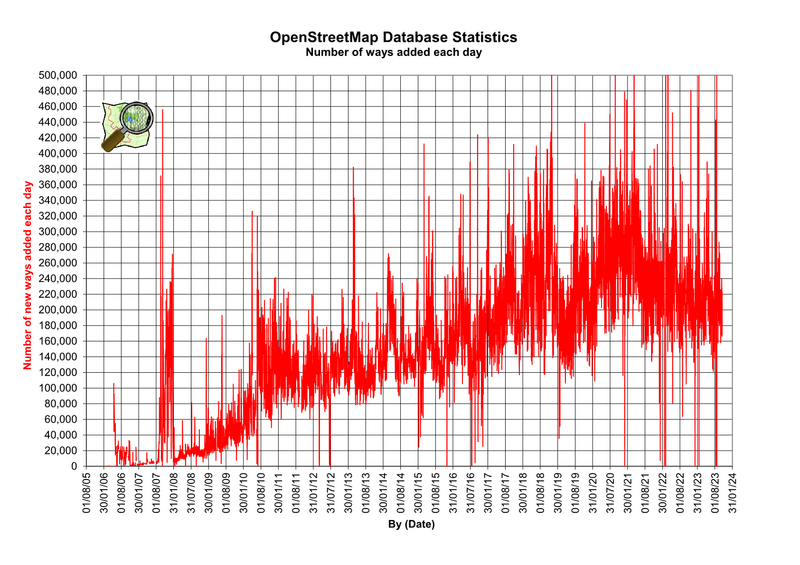
On the following two graphs the statistics count was changed on 2007-08-01. Previous to this date the count includes deleted objects, after this date the count only contains visible objects. This accounts for the drop in numbers at that time.
Accumulated nodes, ways and relations
Accumulated ways and relations
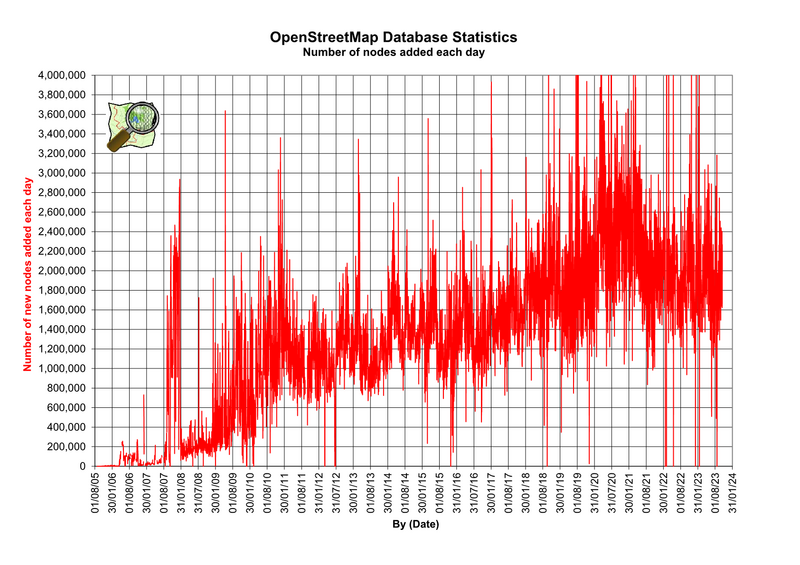
New nodes and ways added per day
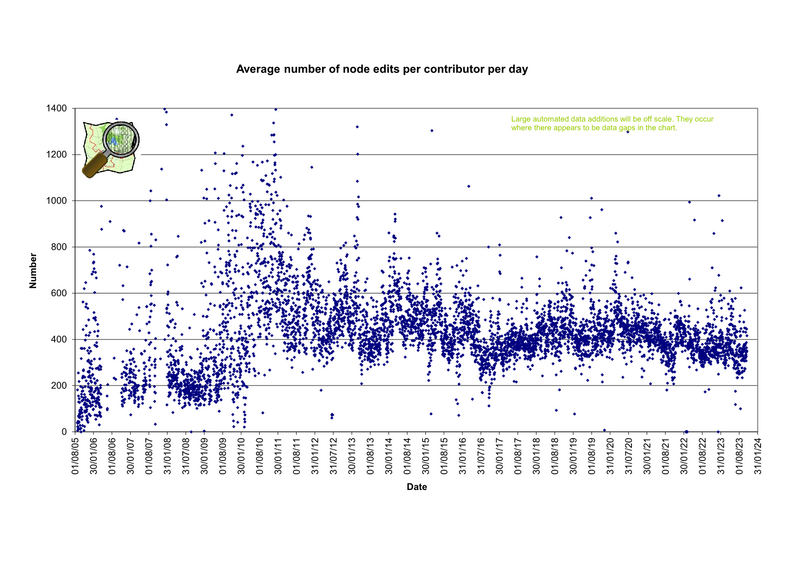
Edited nodes per contributor per day
Contributor statistics reports
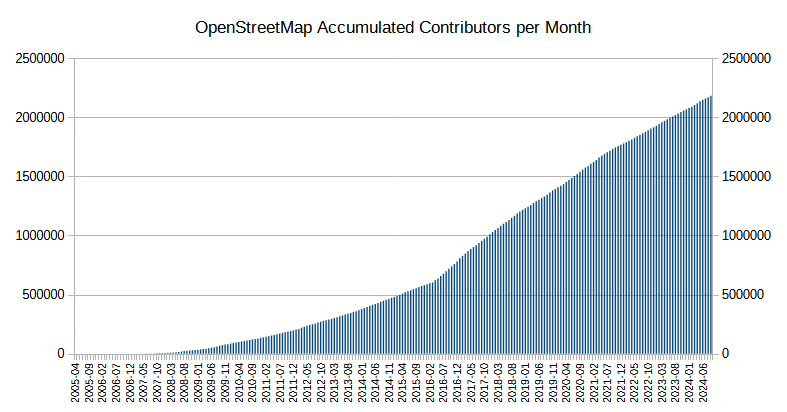
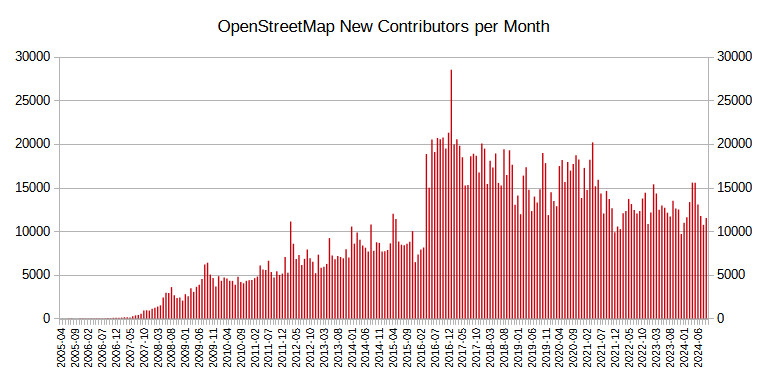
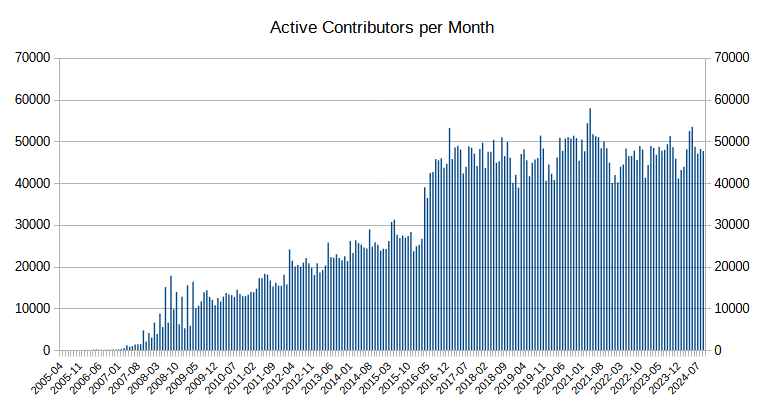
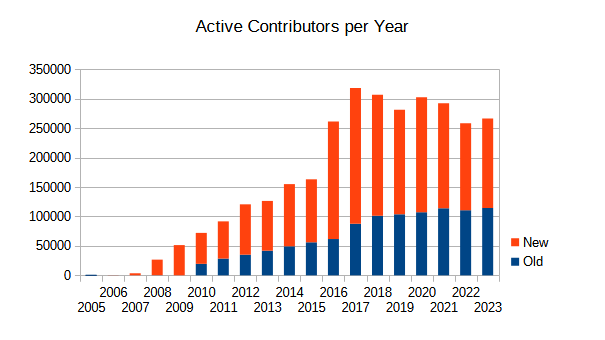
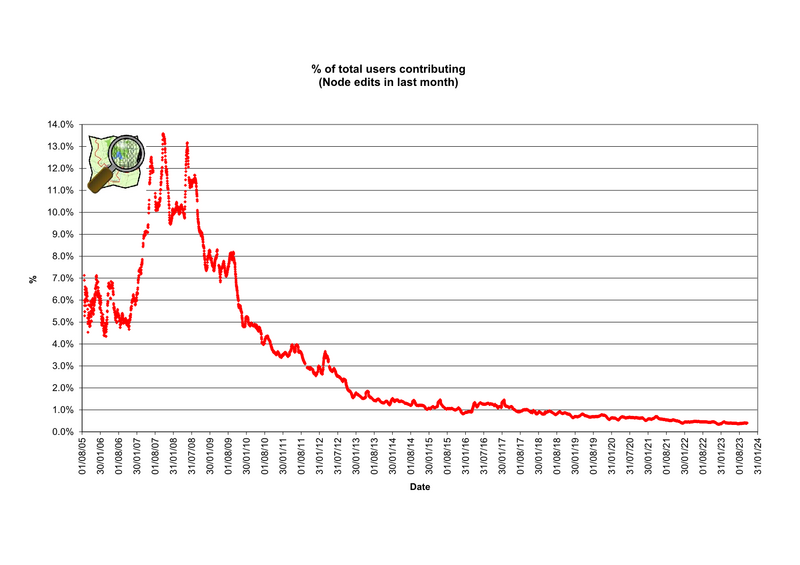
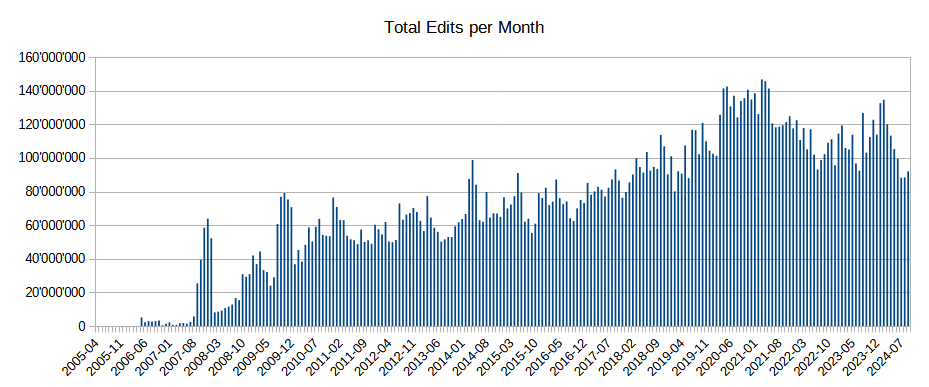
These statistics are generated from the changeset diff feed from planet.openstreetmap.org and show numbers on users that have actually made edits. Changesets were introduced in early 2009, for edits prior to that date changesets were generated retroactively. That and the phasing out of anonymous edits between 2007 and 2009 may cause some differences prior to 2009 in the numbers to other methods of counting.
The graphs show a strong impact of the introduction of the editing feature in the maps.me app, please have a look at updated statistics for 2018 diary post for more information.
Total accumulated contributors to the data
New contributors per month
Active contributors per month
Active new and old contributors per year
New and old contributors are not discriminated in 2009 or before as it is not possible to track them prior to the introduction of changesets in 2009: most of them however were new contributors compared to the previous year where the total in 2009 was a lot larger than those registered and contributing since 2008 or before.
Active contributors per month relative to total number of accounts
Edits per month
Total edits of any kind (the sum of the number of changes in all changesets, as reported by num_changes value) per month.
Database statistics - Historical charts and reports
Changeset Statistics (2005-2013)
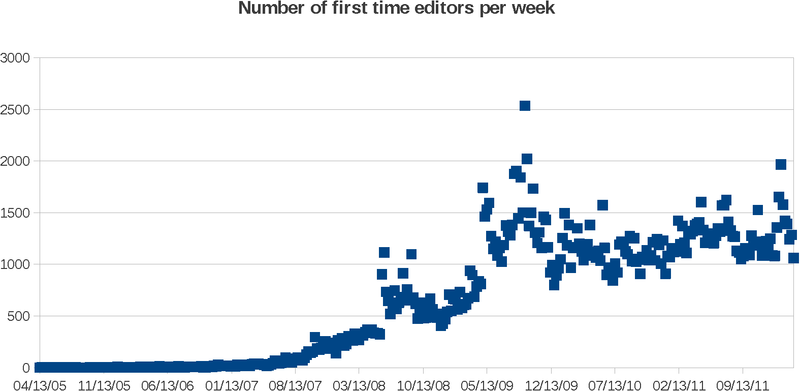
New contributors per week (2005-2011)
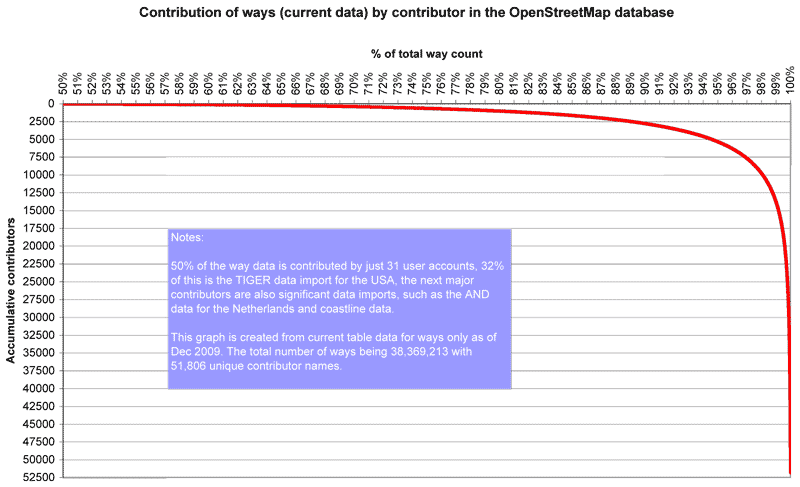
Contribution percentage by user (2009-2010)
Note this is historic data from 2009, a point in time when OSM contained less that 15% of what it contains today (beginning of 2014).
See also: https://apmon.dev.openstreetmap.org/TopChangeContributor.txt (last update was in year 2010: seems to be only history, too)
Tabular historical statistics (2005-2007)
- Database Statistics (2007-01-10)
- Database Statistics (2006) - Tabular
- Database Statistics (2005) - Tabular
Tile usage statistics
Usage of the prerendered map tiles – Talk page
Local statistics
- United States
External sites with active statistics and reports
Some external organisations reviewing/comparing OSM data statistics:
- [1] Map Metrics for OSM
- Ohsome Dashboard generates accurate statistics about the historical development of OSM data for custom regions, tags and time ranges. OhsomeHeX shows heatmaps of selected OSM features (OhsomeHeX).
- OSMStats – Shows statistics by Pascal Neis about OSM users and elements in the database (clone and improvement of the former OSMStats on altogetherlost.com, offline since December 2014).
- How did you contribute – Statistics about every individual mapper.
- Statistics about added OpenStreetMap Notes – Statistics about the Notes feature.
- OSMQualityMetrics – A set of Python scripts you can use to roll your own statistics, works with full history files as well.
- Brave Mappers – A script that processes the output of aforementioned OSMQualityMetrics output into a visual historical overview of mapper activity for an area.
- The most densely mapped locations in OSM – (image and link to a slippy map version).
- Density Maps and Mapping Speed for a few selected countries
- live.openstreetmap.fr – Pulse OSM Mapping (world)
- Statistics about tagged roads length for each country with history, possibility to display info about specific road class
- OpenStreetMap servers - munin live statistics
External sites with archived statistics and reports
- Walking Papers had some statistics on the usage archived version
- Tutorial email on how to measure highway length per country (November 2011).
- "Geo-Analytics on OpenStreetMap Road Data" from Beyonav – Old reports for 2009-2011.
- Germany 2007-2011 – Pascal Neis paper analysed in detail.
- Fossgis 2018 - Lügen mit Statistik, OpenStreetMap Edition(de)
See also
- Research – academic papers plus other research and university involvement
- Quality Assurance – tools for tracking (and sometimes statistically analysing) bugs in the data or the data itself
- History of OpenStreetMap – a prose description of the evolution of the project
