Epworth Mapping Project
|
Atlases |
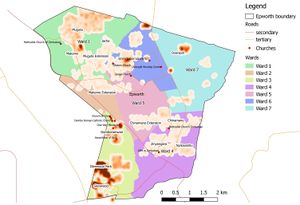
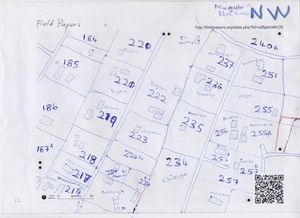
The Epworth Mapping Project has the goal of mapping the suburb of Epworth in Harare, Zimbabwe, for the Missing Maps Project. Data collection for the area, including road networks, landmarks used by local people to navigate, admin areas and unofficial 'neighbourhoods' (again used by locals to navigate). To register the community, and to provide accessible records for the function of infrastructure management, water supply and sanitation needs. Original OSM Task: http://tasks.hotosm.org/project/868
Further, we hope to introduce the advantages of Open Street Mapping to the local community. To consolidate a team of volunteers from the local areas to carry out this task, drawn from MSF Local (National) Staff and members of the Local Administrative Board (mainly Council Engineers), and to strengthen working relationships between humanitarian and local parties.
Date March, 2015 ongoing
Project Managers Kieran O'Sullivan (Humanitarian OpenStreetMap Team), Rupert Allan (Medecins Sans Frontieres), Pete Masters (Missing Maps Project).
Why map Epworth?
Epworth is a large community to the south-east of Harare, the capital of Zimbabwe. We are mapping in order to provide more information about the local water & sanitation infrastructure and to provide a detailed map to enable better community organisation and planning.
Epworth has a different addressing system from most regions. Instead of sequential numbers along a road, each plot has a unique number within Epworth. Therefore, you may need to get to 8143 Epworth, but it is very difficult to know where that is unless you are well-acquainted with this idiosyncratic system. By adding the numbers to the plots, it makes them searchable. This is very useful for NGOs who may wish to find a particular address quickly and efficiently. MSF's work in Zimbabwe is described in their 2014 Activity Report.
If you want to see what Epworth looks like on the ground, you can check out Mapillary's paths.
How to get started with Epworth Field Papers
This page should have almost all of the information you require in order to start transferring information from the field papers to OpenStreetMap. Please leave feedback in the 'talk' section - we want to make this as easy to follow as possible!
These are the main steps:
- Learn how to map
- Download the Field Papers for JOSM plugin
- Choose a tile to work on
- Download the information for the tile
- Upload the map to Field Papers (not always necessary)
- Load Bing, OSM data and the field paper into JOSM
- Start mapping
- Upload and record progress
These steps are shown below in a tutorial.
Getting Started
This section explains how to set up the various layers for field paper mapping in Epworth, doing the mapping itself, and then recording your activity.
Download the Field Papers plugin
You will only have to do this once.
1. Open JOSM
2. Go to ‘Preferences’:
a. In Windows either press F12, open ‘edit\preferences’ or press the preferences button on the toolbar at the top: ![]()
b. In iOS, click on ‘JOSM’ in the top left of your screen and select ‘preferences’
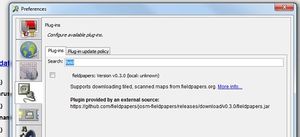
3. Click on the ‘plugins’ button ![]()
and click ![]() Download list at the bottom.
Download list at the bottom.
In the search bar at the top, type ‘fieldpapers’ and the list should now only show one plugin:
4. Tick the box next to field papers, and click ![]() OK at the bottom of the preferences box. You will be asked to restart JOSM; do this.
OK at the bottom of the preferences box. You will be asked to restart JOSM; do this.
Choose a tile to work on from the Tile Completion Record
The tiles have been split into four quadrants (NW, NE, SW, SE) and are then referred to by a typical letter-number system, where letters refer to location on the East-West axis and numbers refer to location on the North-South axis.
Choose a red or yellow tile from the spreadsheet below, and take note of the tile code (e.g. E5) and quadrant (e.g. SW). Change the colour of the cell in the spreadsheet to pink so that other people know you're working on it - don't forget to change it back yellow or green after you've uploaded your work!
Download the tile information
In this tutorial, we will show you tile NW F8.
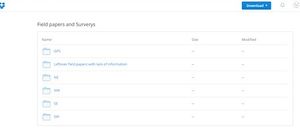
1. Open the Dropbox folder.
2. Choose the relevant region. In this case, it’s NW.
3. Next, open the ‘pack’ for your chosen square. There should be a number of files in here.
It is easier to identify the relevant ones if you change the view to list mode using the right hand button.
4.
- If the Field Papers code was not included in the spreadsheet: Download the image map (listed as the square’s name, i.e. F8.jpg here) and any relevant surveys. There’s only one survey image here, F8 Survey.jpg. Then move on to the next section: Upload the map to Field Papers.
- If the Field Papers code was included in the spreadsheet: Download only the relevant survey files. In the example tile there is only one, F8 Survey.jpg. Skip the Upload the map to Field Papers section and move straight on to Load the layers into JOSM.
Upload the map to Field Papers
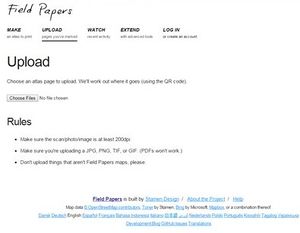
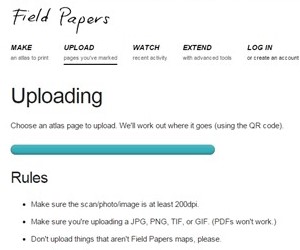
1. Open www.fieldpapers.org and click on Upload. You should get this screen:
2. Click on ‘Choose Files’ and select your map file (in the example case, it is F8.jpg). You’ll get a screen like this:
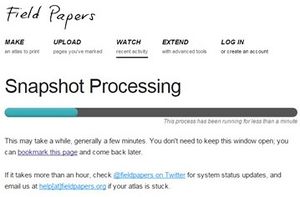
Which will change automatically to this:
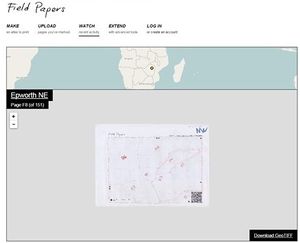
The processing might take a while depending on the number of people using the website. Eventually, you will get a page looking like this:
Note that although this is a NW sheet, it says ‘Epworth NE’. Don’t worry – it’s not a problem and it has been processed correctly.
3. The map’s code is contained within the URL. In the example case, the URL is: fieldpapers.org/snapshots/5ssf4v4i#17/-17.87813733020192/31.142854071614224 The part in bold is the bit you need to copy – it’s between ‘snapshots/’ and the hash (#) symbol.
Interested in where you field paper lies in Epworth?
You can see the grids for each of the quadrants here, in the Field Papers website:
North-West (Note it says NE on the Field Papers website, but this link is correct)
Load the layers into JOSM
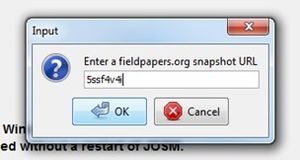
1. In JOSM, click on Field Papers\Scanned map
and copy the code into the box and click OK:
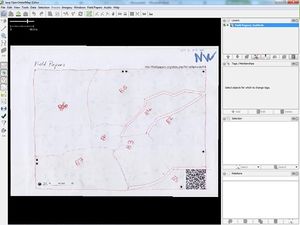
You should get something looking like this:
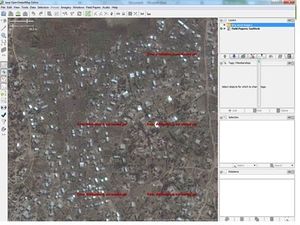
2. Now download the relevant imagery (usually Bing) using the imagery tab at the top of JOSM:
(Note: sorry about the red text over the area - this shouldn't happen for you. If it does, try zooming in and out and see if it disappears)
And the OSM data using the ‘download’ button: ![]()
3. Next, ensure ‘Bing aerial imagery’ is selected in the layers menu, and reduce its opacity using the button on the right-hand side of JOSM just under the layers menu. Use the bar to set the opacity so you can easily see the OSM data, the scanned map and the Bing imagery. An example is below, but you may find a different amount of opacity easier for you. The Opacity button is the one which is a vertical bar changing from black at the top to white at the bottom.
4. Start mapping!
Start Mapping
Tagging in Epworth
The nature of addresses in Epworth means that the tags we use are rather different from those that you would use normally.
The tags you will need are:
- source
- addr:city
- addr:ward
- addr:place
- addr:neighbourhood
- addr:housenumber
- name
- loc_name
- building
- building:material
You may not need to use all of them - there may be information missing. Equally, if there are other tags that aren't included here but you think are relevant, please add them too.
Source
Please enter the key source with the value survey. This allows us to identify what information has come from the field papers and surveys.
City
This tag, addr:city, explains what overall settlement the node is in. The value should be Epworth (with a capital E).
Wards
When Epworth was founded in 1890 it was split into seven wards, and this system still exists in Epworth. They are administrative designations and do not always follow the same boundaries as the other area types!
The tag for wards is addr:ward and the value is the ward number written as a number - e.g. '2' rather than 'Two' - this goes for all numbers in the surveys.
Places
Places (previously Hamlets) are the largest region within Epworth (excluding wards, for the reasons explained above). There are currently 15 'places' which have been identified within Epworth:
- Chinamano
- Chinamano Extension
- Domboramwari
- Glenwood
- Glenwood Park
- Jacha
- Makomo
- Makomo Extension
- Muguta
- Muguta Extension
- Nyikavanhu
- Overspill
- Pamajuta
- Pentagon
- Zinyengere
The tag you want to use for these is addr:place and the value is the name of the place (each word in the name starting with a capital letter, as above).
addr:hamlet was changed to addr:place because addr:place is 1) easily searchable within the OSM GUI and 2) is the standard for places where house numbers do not correspond to streets.
All other names of areas are treated as neighbourhoods, as shown below...
Neighbourhoods
Neighbourhoods are areas within places. There are many of them noted in the field papers. They are names which have sprung up as the neighbourhoods emerged, and as such there are some quite interesting ones!
The tag for neighbourhoods is addr:neighbourhood and the value is the name of the place (each word in the name starting with a capital letter).
Note that neighbourhood has the British spelling rather than the American spelling.
House Number
As mentioned previously, this is the unique identification of the plot within Epworth. Note that there may be more than one building on a plot.
The tag for this is addr:housenumber. The value of the tag is the number of the plot (e.g. 8413)
Name
Some places will have names rather than, or as well as, a number. An example might be a church, which has a name as well as a plot number.
The tag is simply name.
Local name
Sometimes, more information about the plot is available, for example:
- Often, this is the name of someone who lives there. Anyone whose names are in the field papers have consented to their names being in OpenStreetMap and so it is fine to put these into the map.
- If the building/plot is a shop and has a name, put the name of the shop as its local name and its address number as the name.
The local name is inputted into OpenStreepMap using the tag loc_name.
Building use
The surveys often include what the building is used for. If the buildings are already mapped (they should be), they are likely to have the tag building = yes. If you have information about the use of this building, please update this tag. Examples of values are:
- residential for housing
- retail for shops
Don't use the building tag on nodes denoting plots - only on buildings themselves.
Building Material
Many of the surveys mention what the buildings are made of. There is often more detail on the survey paper than necessary - 'field brick', 'concrete brick' etc should be entered simply as 'brick'.
The key is building:material and the value should be the most suitable on from the list in Key:building:material. (Note: CB in the surveys means 'concrete brick' so it should be entered as brick.
It should be used on the buildings themselves rather than on the node labelling the plot.
Example
For this, I’ll use the SE E5 tile as an example, but you can use a different tile. Mine looks something like this:
The survey looks like this:
Immediately, a few things pop out at us.
Firstly, there’s loads of names of people! This is quite uncommon, but not something we can’t deal with - they go in under the loc_name tag. They’ve used the Neighbourhood column because there’s nowhere else to put the information. This means that the neighbourhood information has been shifted into the area column. This isn’t a massive deal - you just have to work out what the surveyor was trying to get across!
Secondly, the ‘area’ these buildings are in seems to be called ‘Chinamano Origin’ or ‘Chinamano Original’. Although this isn’t one of our 'places', Chinamano is. So here’ we can assume that ‘Chinamano Origin’ is a neighbourhood within the place of Chinamano since the names are so similar. And we should put them all as ‘Chinamano Origin’ rather than ‘Chinamano Original’ because although we don’t know which is correct, there’s only one ‘Original’ and eight ‘Origin’ names on the survey.
Next, we see that most of the buildings have numbers, but not all of them do. That’s okay because the building without a number is a school building. They all have construction materials recorded and are in Ward 4.
The ID# does not need to be recorded in JOSM - it is simply an ID used to match up the buildings on the hand-drawn map with those in the survey paper. They have no other meaning.
So now we know what the main tags will be:
- source=survey
- building=residential (except for B2) - on the buildings themselves
- building:material=brick (except for B9) - on the buildings themselves
- addr:city=Epworth
- addr:ward=4
- addr:neighbourhood=Chinamano Origin
- addr:place=Chinamano
- addr:housenumber= a number (except in the case of B2)
- loc_name= someone’s name (except for B2)
Now we have to put the information into JOSM. It's generally easier to work from the top downwards.
Creating a node
Return to JOSM, with the field paper overlaid, to find B1:
Now we have to create a node in which to put the information. The addresses belong to plots of land rather than buildings, so there are several potential situations:
- There are no buildings on the plot. If this is the case, the node should be placed near the centre of the plot.
- There is one building on the plot. Place the node in the building, but not attached to it. Please create new nodes within, but not attached to, the building you are tagging. This is the standard we are using at the moment.
- There are multiple buildings on the plot. Try and put the node in/near the largest building, or in the middle of any cluster of buildings on that plot.
Back with our example, it appears that the building highlighted is the relevant one - it’s quite large and is right by the B1 marker. To create a node, click the draw nodes’ button like this in the top-left of JOSM, or press the A key on your keyboard. Your cursor should now turn to a crosshair.
Double click to add a node where the cursor crosshair is. You don’t want the building in which you’re placing the node to be highlighted when you do this. If you can’t manage to un-highlight the building, zoom in two or three steps and try again. Go back to select mode by pressing S or the select button in the top-left of JOSM.
The node should look something like a small red square:
It’s red rather than yellow because it’s automatically selected for editing. If you change to select mode, you can deselect the node and it will turn yellow. To select it again, ensure you’re in select mode and single click on the node.
You can move the node when you’re in select mode and have it selected by dragging it across the screen.
Now we need to add the tags to the node.
Add the tags to JOSM - Special Tagging preset method
There is now a preset especially for Epworth!
- You can download it here: http://visualtags.hotosm.org/collection/571 - press 'Download as XML preset' at the bottom of the page
- Go into JOSM, and download the OSM data for any piece of land. This will allow you to access the presets menu.
- Next, open the presets menu and select 'Preset preferences'.
- On the right of the box, there is a '+' button. Click on this, and put a relevant name in the 'name' box, e.g. Epworth Residential.
- For the URL/File box, press on the folder icon to the right of the box. Select the file you downloaded in step 1.
- Click OK. You will be asked to restart JOSM; do this.
- When JOSM reopens, you should be able to use the preset. It will appear in the list in the preset menu, and is applicable to nodes only.
- Create a node for a survey item (see the example below). While the node is still selected, click on the Epworth Residential preset. This will give you all of the fields explained above. Enter the ones for which you have information, and leave the others blank.
- Now skip the original method section immediately below and move on to the 'copying nodes' section.
Add the tags into JOSM - original (and slower!) method
To do this, ensure that your Tags/Memberships section is open. It is on the right hand side under layers and above Selection.
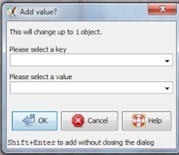
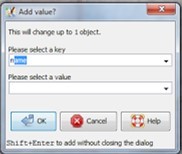
With the node selected, click the button and a box will appear, looking something like this:
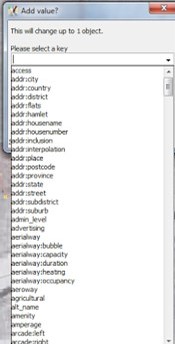
This is where we add tags. The top field is for the tag type, and the bottom one is for the value of that tag. If you look at the drop-down menu you will see dozens of tag types:
You can also just start typing one, and it may autofill the correct word:
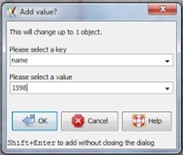
To select that tag type, either press Tab ↹ or click in the bottom box. Then, add the necessary value. In this case, it’s 1598:
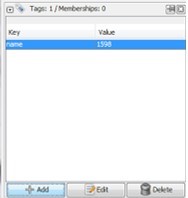
Click OK or hit Enter to confirm the new information. You will see it pop up in the Tags/Memberships section on the right hand side:
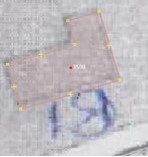
Depending on what type of tag it is, it may have modified the node’s appearance too. In this case, the name appears next to the node:
Next we add the other values. building=residential also affects its appearance:
Eventually, the list of tags should looks something like this:
Well done! You’ve tagged your first building.
Copying nodes
When you do your subsequent nodes, it is often easier to copy a node than to start from scratch again. For example, we can copy our recently-created node by selecting it, pressing Ctrl+C (Command-C on a Mac?), placing our cursor where we want to build the new node, and pressing Ctrl+V (Command-V) to create it:
It has all the same attributes as the original node except for its location. So you’ll need to change some of the tags to update it to the relevant information. I’ve dragged the node to the correct place, in this case in the building B2:
It’s still in Chinamano Origin (and therefore Chinamano too), and also still in Ward 4. It’s made of bricks too, so none of these tags needs to change. We will need to change the name, the building type and remove the loc_name tag.
To remove a tag, highlight it in the list of tags and click on the "Delete" button
To edit a tag, highlight it in the list and click the button (no surprises there). The dialog box reappears, and you can now change whatever you need to, and then click OK to confirm the change.
Here, I’ve changed the name to ‘School Staff House’. This could arguably go as a loc_name but I’ve put it in as a name as this is likely to be the primary identifier of the building. If it had a number like the local houses, the number would go under name and School Staff House under loc_name.
Keep doing this with all the lines in your survey until you’ve finished it!
Alternative Survey/Map
Sometimes the survey information is written directly onto the map:
There isn't a separate survey sheet for these - pleae just try your best to interpret the information on the map.
If you have more survey paper records than are recorded on the field paper, or vice versa, please mention this when recording what you've accomplished (the section coming up).
Upload and record progress
Upload
Now you need to upload your work to the server. Press the upload button in the top left of JOSM. Please use the tag '#MissingMaps #EpworthSurveys'
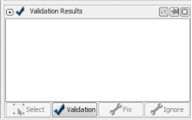
You may get some validation errors - please fix these if you can! They will be detailed in the Validation box in the bottom right of JOSM:
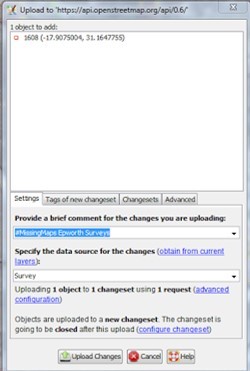
Once those are dealt with, this screen should appear, with all of your work summarised:
This shows only one node being uploaded, but yours should show as many as you’ve created. Please write #MissingMaps #EpworthSurveys in the comment box, and write Survey in the data source. If you’ve used Bing imagery for anything, include that as well, separating them with a semicolon and a space, i.e. Survey; Bing
Press Upload Changes to upload your changes. If you’re not logged in, you may be asked to enter your OSM login details first.
Record
Upload your changes to the Tile completion record by changing the colour of the cell corresponding to the tile you've just worked on to yellow if you didn't finish it, or green if you did. Please don't leave it as pink - it'll stop others working on it!
If you've got extra plots on your field papers than your surveys or vice versa, mention this in the comment on the Tile completion record on the square relevant for your tile.
This is the end of the tutorial
Uploading digital field data to OSM
Note: This is strongly discouraged unless you know what you are doing! This is not a recommended workflow.
Overview
This method is for taking data collected by field mapping using apps on digital devices, e.g. OpenDataKit (ODK). It does NOT relate to Field Papers. It is meant to be a quick and easy method of importing the data but also verifying it before it is uploaded to OSM.
- Install the Opendata plugin in JOSM
- Modify the database file to enable Opendata to read it
- Upload to JOSM
- Verify data
- Upload to OSM
Set-up (once per computer)
Download the Opendata plugin
- Open JOSM, and go into the Preferences folder (on a PC, the shortcut is F12).
- Click on the plug and socket icon on the left-hand side (fourth icon).
- Press the Download list button at the bottom to update your plug-in list
- Once that is complete, type opendata in the search bar.
- Click the checkbox next to opendata so that it is checked. Click Ok at the bottom of the screen.
- Reload JOSM.
Check computer compatibility with Opendata (on a PC)
Opendata uses semicolons as delimiters in csv files, but not all computers are set up to use them. This can be changed in the computer's global settings.
- In your Start menu, click on Control Panel.
- Choose Region and Language
- Click on Additional Settings
- Ensure that List separator is set to a semicolon (;), rather than a tab or comma.
- Click Apply and then OK if you have changed it; otherwise, simply click OK.
Modifying database files
The idea behind this section is to ensure that JOSM can read the information you give it. A brief guide about how a well-formatted csv file should look is available on the Opendata page.
