User:Moresby/Understanding Mapnik/Placing images at points
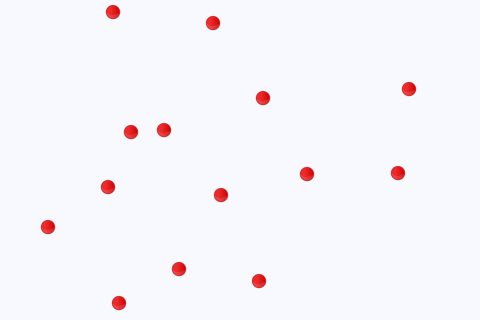
When we want to add points to our map, we are likely to want to represent them as more than just a small black square. Mapnik allows us to put the image of our choice at the points we plot, as we can see from this program.
#!/usr/bin/python

# Load the Python mapnik libraries.
import mapnik

# Create a new map.
m = mapnik.Map(480, 320)

# Set the background colour.
m.background = mapnik.Color('ghostwhite')

# Create a point symbolizer.
point_symbolizer = mapnik.PointSymbolizer(mapnik.PathExpression('circle_red_16x16.png'))

# Create a new rule and add the symbolizer.
r = mapnik.Rule()
r.symbols.append(point_symbolizer)

# Create a new style and add the rule.
s = mapnik.Style()
s.rules.append(r)

# Add the style to the map.
m.append_style('basic_style', s)

# Specify that our data is coming from a CSV file called "data-places.csv".
ds = mapnik.CSV(file='data-places.csv')

# Create a new layer for the map, called "main_map" and add the data
#   source and style to that layer.
l = mapnik.Layer('main_map')
l.datasource = ds
l.styles.append('basic_style')

# Add the layer to the map.
m.layers.append(l)

# Zoom to the part of the map we are interested in.
m.zoom_to_box(mapnik.Box2d(0, 0, 480, 320))

# Save the map as a PNG image.
mapnik.render_to_file(m, '021-points-images.png', 'png')
To run this program, we need the file circle_red_16x16.png which is the image we want to draw on the map. You could use any PNG image for this, but the file used in this demonstration can be obtained by pasting the following data into a file called circle_red_16x16.png.base64:
iVBORw0KGgoAAAANSUhEUgAAABAAAAAQCAYAAAAf8/9hAAAAAXNSR0IArs4c6QAAAAZiS0dEAP8A
/wD/oL2nkwAAAAlwSFlzAAALEwAACxMBAJqcGAAAAAd0SU1FB94MHg86Jm0uBusAAAK/SURBVDjL
dVJbSFRRFF37nHlex3xcL7eihyJqD8OyIoIy6AnZR0EQ+FEREthPIQUifVgQCSGk9BLC/CgkoqiI
LCOSSEqCCKJSjERLHBx1rFGbuY+z+5gyM1s/h3NYa7HPWltiGpaV7UXk3Yfk5cZV7zZNS8spWhHs
PVKu8OCRi1lAMx9Ol2zI29jXX2G4aocfbCoGfhDC4UCgrTU/t7H+Ym03copnMWCmBwX5FYXx+LnU
oKYxwLZtw3EcuI4DKEVxoljnXLP6wL7dV1BV4wCA/CXGw4L8Y6sdt0HTUiQLQawUHGZi1yWXmWzb
Btu2L3tycmfxl4Fvd8/UvFpbkJM0OP+4tWjT2PdbQU0jBQgCwEqRqxRYKShmKNeFYiY7YfFCyyrx
REef3GluGRAAsG4wfCKkaV7FLKb+RARi/jswIrBSRBOTwa29/UfRfEmI4sMHU7OYNzMRExH/kzDR
30kLAcuyMC82vqmw840utvR81v1EWf9rBUQAc/L8BcWMgG1nLo2MGIIBAa8P8HiSxBngaZOAeYrD
YGKAxMvFC6Nx5qjQdcDrBU8zmW5HzIDfD5meDm9GBuI+/1hfetqo6Lh2fWxIuS/IcUjoOsScOYAQ
U2ICgGAQ0jThMQyIUAiBUAhfU0OdrxfMGxYg4ufz59bHhoZcEDGlpIAMA8IwIE0TwjQhdR2QElAK
BLBl29aT7EWXUXPWFgBQfajsRacUtVYkQgCYiACPByQlIMRvISAE+xJxemYaDc15uU//bOL9Vr5X
vr+jqPsTGaPR9QG/X0JKcHKhku1ZFuLj43abkVVXv2bVqfCFxsSUQemu7fjYdN29XVXZ7otE2sXg
YIij0XQ3FvMkJibskcmJyHsp2lqW5FXWrVzeFL7QmNizpxRdXT2z9A4AN5vkyvYOPXd4NJMB8Tkr
c+Rtbs4Ijp90ZlJ/AlJPN18OgwxVAAAAAElFTkSuQmCC
- and then running the following command:
base64 -d < circle_red_16x16.png.base64 > circle_red_16x16.png
- This image was generated by scaling image
icons/png/32x32/others/circle_red.pngfrom the Open Icon Library to 16x16 pixels.
- The only significant change here compared to the previous program is in line thirteen. Here we tell Mapnik the filename of the image we want to use to mark our points. Like Mapnik colours, we don't simply specify a filename, but we create a Mapnik PathExpression object to pass to
mapnik.PointSymbolizer. - It's worth noting that we don't have to specify the image format - Mapnik determines this when it loads the file. Here we use a PNG image, but other image formats supported include JPEG and TIFF.
Save this program in a file called 021-points-images.py and run it by typing:
python 021-points-images.py
You should see no error messages, and you should see a new file in your working directory called 021-points-images.png. This is a new map image, and should be a light-coloured rectangle 480 pixels wide by 320 pixels high, with some small red circles marking the positions of the items in the data file, as shown above
