User:Moresby/Understanding Mapnik/Using layers to draw points and lines
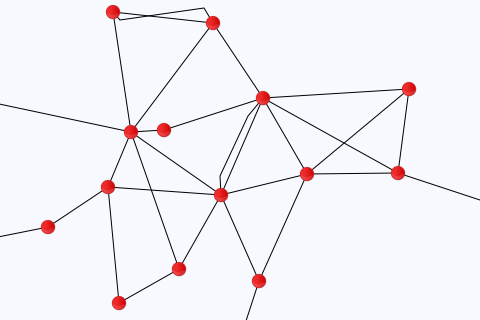
So far we have drawn points or lines, not both. To put both lines and points on the same map, we are going to make use of Mapnik's layers. A map can have several layers, and Mapnik draws each of them in turn, with details on each new layer potentially covering up content from previous layers. This approach is sometimes referred to as the painter's algorithm. Here we put our lines in one layer, and our points in a different layer, ensuring that the points layer is painted after the lines layer, to get the effect we want.
#!/usr/bin/python

# Load the Python mapnik libraries.
import mapnik

# Create a new map.
m = mapnik.Map(480, 320)

# Set the background colour.
m.background = mapnik.Color('ghostwhite')

# Create point and line symbolizers.
point_symbolizer = mapnik.PointSymbolizer(mapnik.PathExpression('circle_red_16x16.png'))
line_symbolizer = mapnik.LineSymbolizer()

# Create new rules and add the symbolizers.
r_point = mapnik.Rule()
r_point.symbols.append(point_symbolizer)
r_line = mapnik.Rule()
r_line.symbols.append(line_symbolizer)

# Create new styles and add the rules.
s_point = mapnik.Style()
s_point.rules.append(r_point)
s_line = mapnik.Style()
s_line.rules.append(r_line)

# Add the styles to the map.
m.append_style('point_style', s_point)
m.append_style('line_style', s_line)

# Specify our data sources.
ds_point = mapnik.CSV(file='data-places.csv')
ds_line = mapnik.CSV(file='data-roads.csv')

# Create new layers for the map, add the data sources and styles to
#   those layers.
l_point = mapnik.Layer('point_layer')
l_point.datasource = ds_point
l_point.styles.append('point_style')
l_line = mapnik.Layer('line_layer')
l_line.datasource = ds_line
l_line.styles.append('line_style')

# Add the layers to the map. We want the points to appear in front of the
#   lines, so we add the line layer first.
m.layers.append(l_line)
m.layers.append(l_point)

# Zoom to the part of the map we are interested in.
m.zoom_to_box(mapnik.Box2d(0, 0, 480, 320))

# Save the map as a PNG image.
mapnik.render_to_file(m, '040-layers.png', 'png')
- This example combines the work we did previously placing images at points and plotting lines. Whereas before we had one symbolizer, one rule, one style and one layer, here we have two: one for points and one for lines.
- For the points, we create a PointSymbolizer at line thirteen, a rule at line seventeen, and a style a line 23.
- For the lines, we create a LineSymbolizer at line fourteen, a rule at line nineteen, and a style a line 25.
- We give each of the styles its own name (
point_styleandline_style) at lines 29 and 30. - We create two data sources, one for the points and one for the lines, at lines 33 and 34.
- We create two layers, one for points and one for lines, at lines 38 and 41, and configure the layers' datasources and styles.
- Lastly we add the two layers to the map object at lines 47 and 48. So far, the order in which we have prepared each of the layers has not been important, but here it matters. Where the towns and cities are, we want the red circles (the points layer) to cover up where the lines join (the lines layer). The order we add the layers to the map object is the order in which Mapnik paints them, so we add the lines layer first, then the points layer.
Save this program in a file called 040-layers.py and run it by typing:
python 040-layers.py
You should see no error messages, and you should see a new file in your working directory called 040-layers.png. This is a new map image, and should be a light-coloured rectangle 480 pixels wide by 320 pixels high, with a series of red circles interconnected by black lines, as shown above.
