Knooppuntnet monitor
| About | Planner | Analysis | Monitor | Issues | ||||||||||||||||
MonitorWhat does the monitor do?The main goal of the knooppuntnet website is to help with mapping hiking and cycling node networks in OpenStreetMap, and to provide a tool for planning hikes or bicyle trips over these node networks. The monitor functionality in knooppuntnet was added to also help with the mapping of long distance routes in OpenStreetMap. It provides an analysis of end user selected long distance routes for quality assurance purposes. Although there are a lot of similarities, this long distance route functionality can be seen as completely separate from the node network functionality in knooppuntnet. The knooppuntnet planner does not cover long distance routes. The analysis of the long distance routes has two major parts: 1. segment analysis 2. comparison with reference
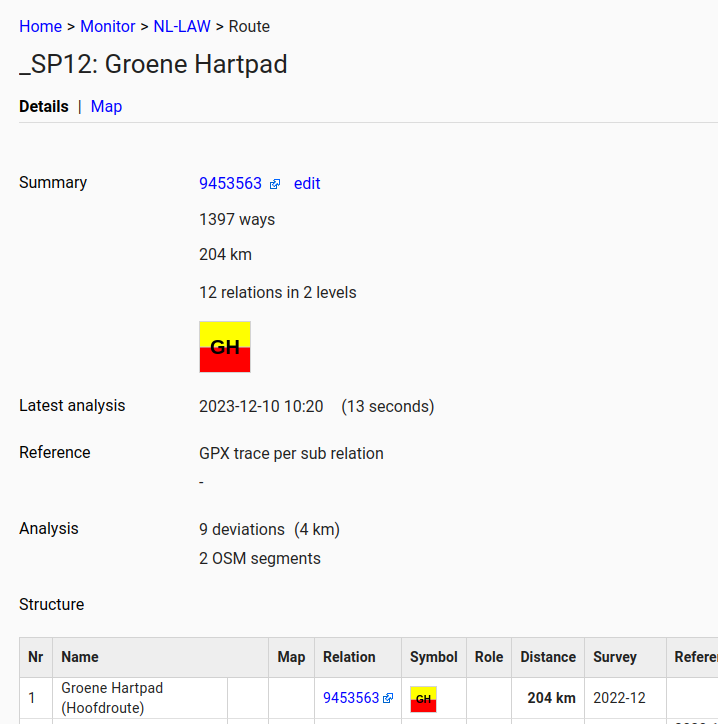
How does segment analysis work?The original segment analysis made the assumption that the route has to go from start to finish through a sequence of ways all connected to each other forming one line between start and finish. When this sequence of ways is interrupted at one point (for example through an edit where a way that was part of the route relation is deleted) the route consists of two segments. Likewise, when there are two such interruptions, there are three segments. In the route structure table in the details page, the fact that there are one or more interruptions is shown by two red squares interrupting the route line (similar to how non-connecting ways are shown in JOSM. Next to that, the number of segments is shown if there is more than one segment.
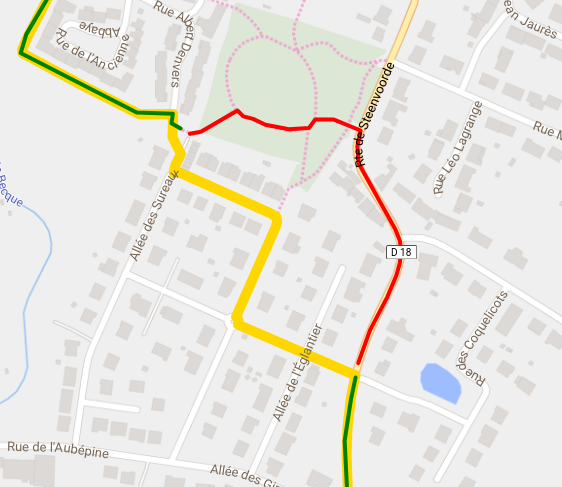
At the time of this writing (Dec 7th 2023), the segment analysis is still a bit naive and does not take roles on route members into account, and assumes routes to go in one direction from start to finish only. As a result of that, the segment analysis for bicycle routes (for example EuroVelo) is currently not very good and roundabouts are not processed very well. For routes with members with roles such as forward/backward, alternative, excursion, approach or connection, multiple segments will be reported although the route structure in OpenStreetMap is perfectly fine. The segment analysis should be improved in this area in future versions of knooppuntnet. How is the comparison with reference done?The main idea behind the monitor functionality (and the reason for its name) is to guard (monitor) the quality of the route mapping in OpenStreetMap by comparing the actual mapping in the OpenStreetMap database with a known good state of the route. The known good state to compare against (called reference in knooppuntnet) can be one of the following: 1. the state of the route in OSM at a given moment in the past 2. a GPX trace
The details page shows the overall number of deviations found for the route. If the route consists of multiple relations, the route structure table has a column with the number of deviations per relation.
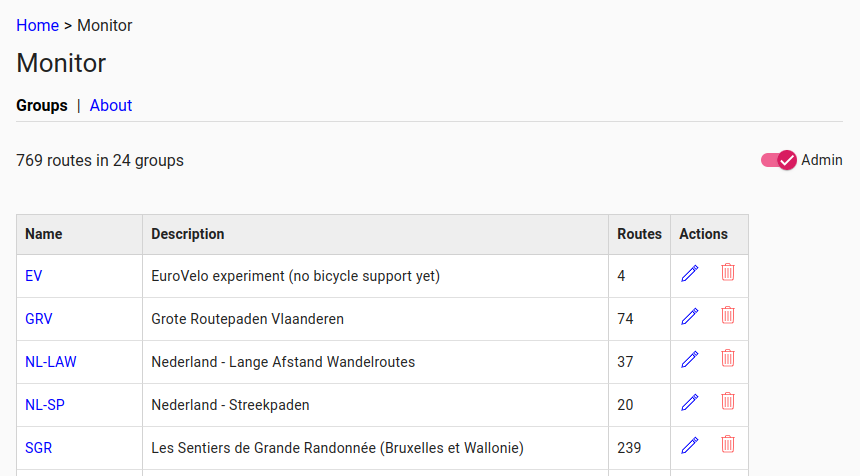
How to add a route group?Within the monitor, the routes are organized in route groups. Routes that belong together are placed in the same group. The idea is to have separate groups for routes that are being maintained in OpenStreetMap by different people. There can be groups per operator or per country, or groups could be created by individual mappers who take special interest in maintaining a subset of long distance routes. To add a new group to the monitor, the route "admin" functionality has to be switched on using the slide toggle in the top right corner.
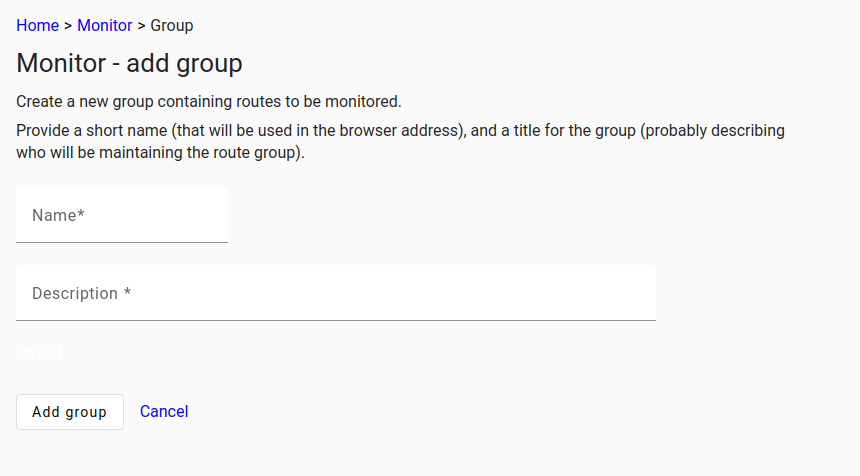
To add a new group, click the Add group button at the bottom of the groups page. Then provide a short group name, and add a short description of the group. The group name has to be unique and have a maximum of 15 characters. Click Add group to save the new group to the knooppuntnet database.
Click the group name link in the groups table to view the list of routes in that group.
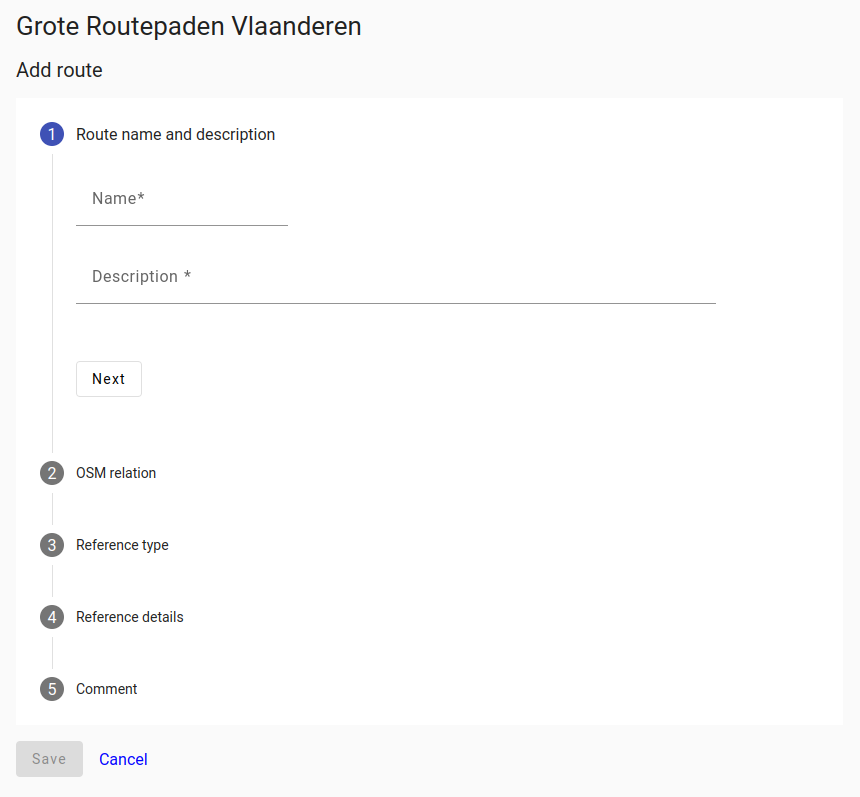
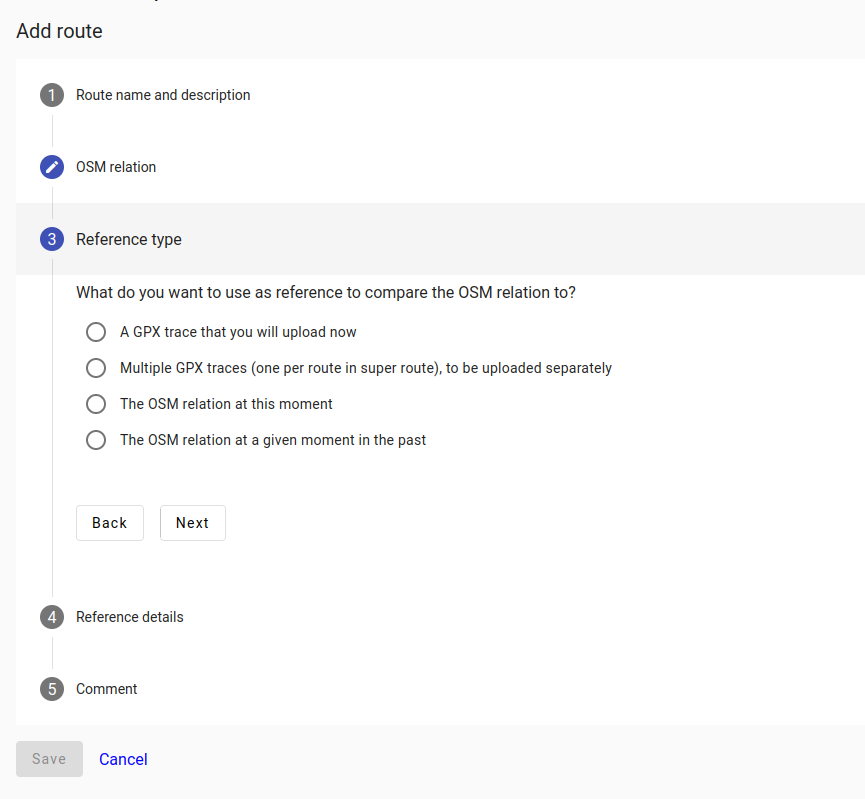
How to add a route?From the group page, click the Add route button at the bottom to add a new route to the group. A monitor route definition consists of 5 bits of information (5 steps):
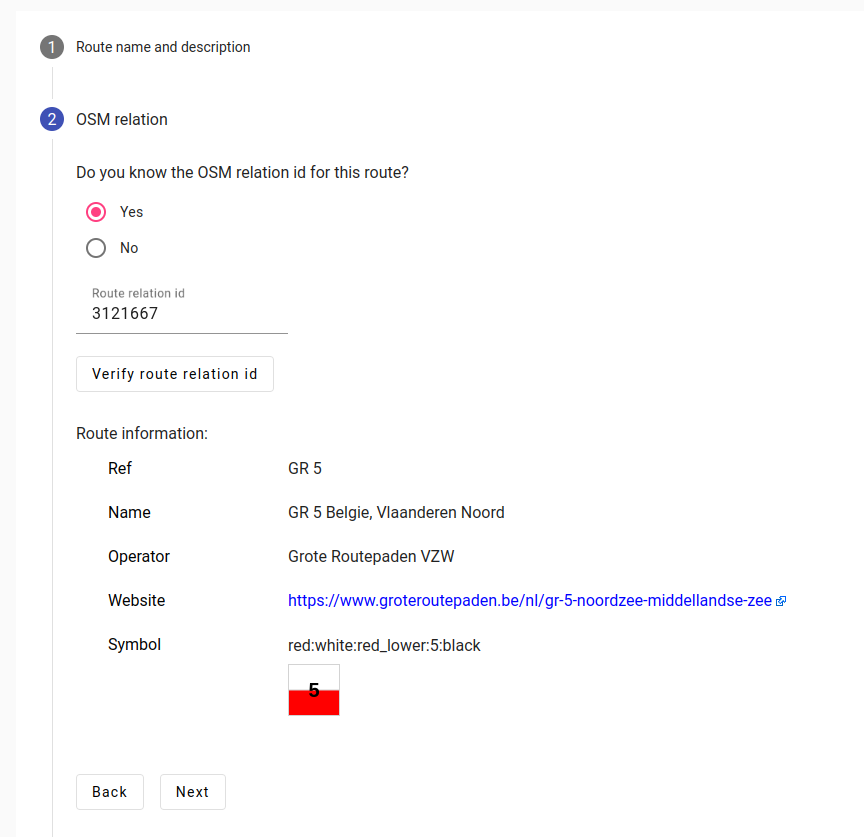
Next, the OpenStreetMap relation id for the route has to be provided:
When comparing against a known state of the relation in OSM, one can select to use the current state or the state of the relation at a date in the past. Depending on which reference type was selected in step 3, step 4 can ask for further details (file to upload, reference day). Click the Save button to save the route definition. If enough information is available, a first analysis of the route will be performed now.
How to view route analysis result details?Click on the route name link in the route table in the group page to view a summary of the route analysis results (the route detail page). For super-routes, a table with the route structure is shown.
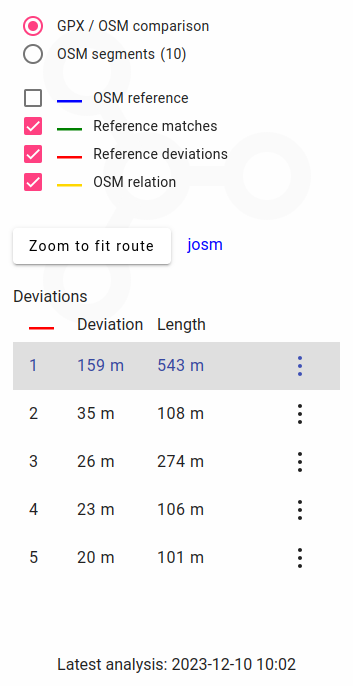
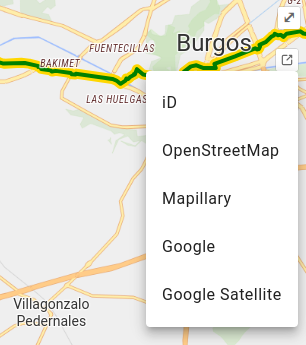
How to view the analysis result on a map?Click on the map link in the route table in the group page (or the map tab in the details page) to view the route analysis result in a map. Use the radio buttons in the top left to switch between showing deviations and route segments (if there are any).
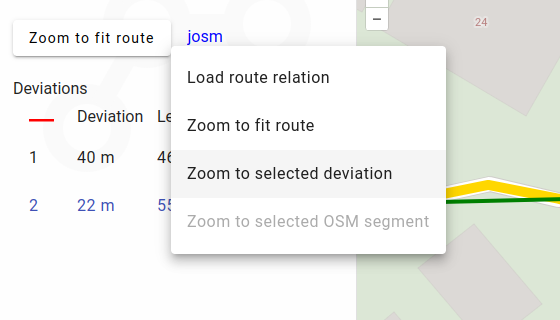
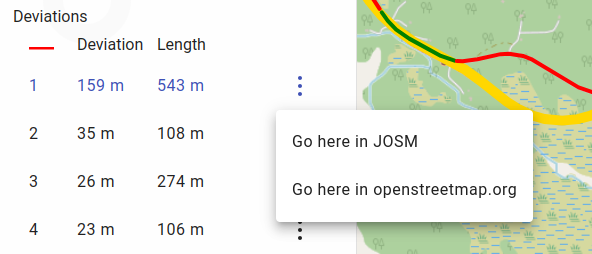
Click on and OSM segment in the list to zoom/pan to that segment on the map. Click on a deviation in the list to zoom/pan to the deviation on the map. Click on the josm link to communicate to the JOSM editor.
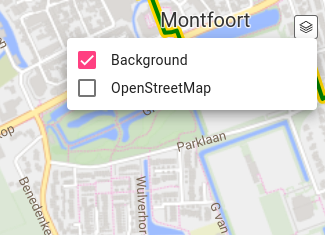
So, the default background is not always completely up-to-date, and does not cover all countries that are interesting for monitoring long distance routes. This is why it is possible to switch to using OpenStreetMap provided tiles instead. This is assumed to be ok with the tile policy as the monitor functionality is intended for directly supporting mapping activity, and usage will not be heavy.
What is the update frequency?Currently, the monitor analysis (comparison between the route relations in the OpenStreetMap database and the references) is performed every two hours (starting on the even hours). The analysis logic was designed originally for long distance routes in Belgium, and the processing was finished in a couple of minutes. Since then, a lot of long routes have been added. At the time of this writing (Dec 7th 2023) it takes about 105 minutes to complete the analysis (769 monitored routes, more than 4350 references, more than 930000 ways, almost 300000km of routes). In the future, the intention would be to not re-analyze all routes every two hours, but to process the minute diffs, just like is done today for the knooppuntnet node networks. This should scale better, and provide up-to-date information perhaps 10 minutes after the edit in OpenStreetMap.
Future work?The knooppuntnet monitor functionality is still very much work in progress. Some of the work to do includes:
Interesting links |
||||||||||||||||||||


