User:Moresby/Understanding Mapnik
Starting with Python
Setting a background colourThe absolute basics. If this works, you're ready to start. More>> |

|
Plotting pointsWe start by plotting some points on a map - in this case towns and cities. There's a fair bit to take in here, but it's all important. More>> |
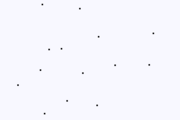
|
Placing images at pointsNow we choose a symbol to go at each point. More>> |
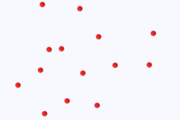
|
Plotting linesWe now plot some lines - in this case roads and railways. More>> |

|
Specifying line colour and widthHow to specify the look of a line: colour and width. More>> |
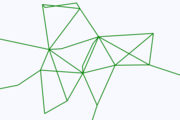
|
Specifying line stylesFor more flexibility, we can choose dotted or dashed lines. More>> |
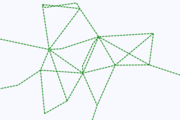
|
Using layers to draw points and linesNow we put the points and lines on the same map. More>> |

|
Using filters to represent dataWe can choose how individual points and lines are shown, based on information about what they represent. More>> |

|
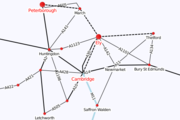
Adding text to the mapNow we can label some of the features we've added. More>> |
|
Using XML and CSS
Representing map designs in XMLNow we can label some of the features we've added. More>> |
Revisiting our examples in XMLNow we can label some of the features we've added. More>> |
CSS styling with CascadenikNow we can label some of the features we've added. More>> |
CartoCSS and PostGIS
Using CartoCSSNow we can label some of the features we've added. More>> |
Specifying the drawing orderNow we can label some of the features we've added. More>> |
Using PostgreSQL and PostGISNow we can label some of the features we've added. More>> |
Specifying geometry typesNow we can label some of the features we've added. More>> |
The Google Maps projectionNow we can label some of the features we've added. More>> |
Specifying geometry constraintsNow we can label some of the features we've added. More>> |