User:Moresby/Understanding Mapnik/Specifying line styles
Jump to navigation
Jump to search
Understanding Mapnik
A Mapnik tutorial
Starting with Python
Using XML and CSS
CartoCSS and PostGIS
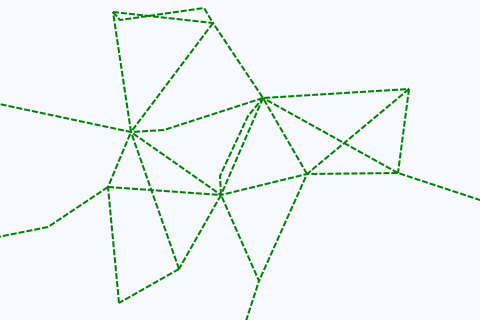
By using a Mapnik Stroke object, we can configure more details of our lines than just the colour and width. Here we use the dasharray attribute of the Stroke object to specify how we want our dashed lines to be drawn.
#!/usr/bin/python

# Load the Python mapnik libraries.
import mapnik

# Create a new map.
m = mapnik.Map(480, 320)

# Set the background colour.
m.background = mapnik.Color('ghostwhite')

# Create a stroke object.
stroke = mapnik.Stroke()
stroke.color = mapnik.Color('green')
stroke.dasharray = [ (6, 2) ]
stroke.width = 2

# Create a line symbolizer.
line_symbolizer = mapnik.LineSymbolizer(stroke)

# Create a new rule and add the symbolizer.
r = mapnik.Rule()
r.symbols.append(line_symbolizer)

# Create a new style and add the rule.
s = mapnik.Style()
s.rules.append(r)

# Add the style to the map.
m.append_style('basic_style', s)

# Specify that our data is coming from a CSV file called "data-roads.csv".
ds = mapnik.CSV(file='data-roads.csv')

# Create a new layer for the map, called "main_map" and add the data
#   source and style to that layer.
l = mapnik.Layer('main_map')
l.datasource = ds
l.styles.append('basic_style')

# Add the layer to the map.
m.layers.append(l)

# Zoom to the part of the map we are interested in.
m.zoom_to_box(mapnik.Box2d(0, 0, 480, 320))

# Save the map as a PNG image.
mapnik.render_to_file(m, '032-lines-stroke.png', 'png')
Detailed explanation of this program
- What makes this program different from the last two example is that we create a Mapnik Stroke object. This has many different ways in which we can change the way in which the line is drawn: we can specify not just its colour and width, as we have done before, but also its dash pattern, its transparency, how line ends and joins are handled, and other aspects. In this example we stick with two pixel wide green lines, but we choose a dash pattern using the
dasharray. In line fifteen, we specify the value[ (6, 2) ]for our dashes: a Python list with one Python tuple. In this case, we are saying that when drawing the line, Mapnik should draw for six pixels along the line and then leave a two-pixel gap. This pattern is repeated. - It's possible to use this approach to generate quite complicated patterns by putting more than one tuple in the list. For example, specifying a dasharray value of
[ (8, 2), (4, 2), (4, 2) ]produces a line which has a repeating pattern of one long dash and two short ones.
Save this program in a file called 032-lines-stroke.py and run it by typing:
python 032-lines-stroke.py
You should see no error messages, and you should see a new file in your working directory called 032-lines-stroke.png. This is a new map image, and should be a light-coloured rectangle 480 pixels wide by 320 pixels high, with a series of interconnected dashed green lines, as shown above.
